


When working with data, you should always be aware that values could be missing.
.isna() – is a method that will tell you you how many NaN’s there are by returning the value True. NaN stands for Not a Number (i.e. blank).
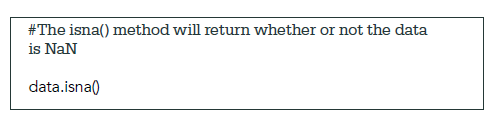
So if we run this code with the Titanic dataset…
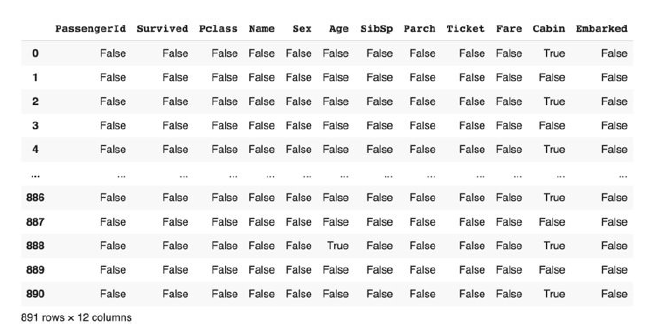
…we can see what data is missing by looking where the values have returned as True!

Watch: Missing Values
Watch the video to learn more about the significance of missing values in data.
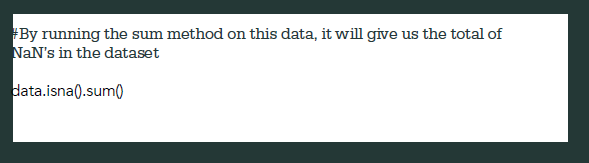
You can also run the sum method on data to get a clearer idea of the number of NaNs in your dataset at first glance:
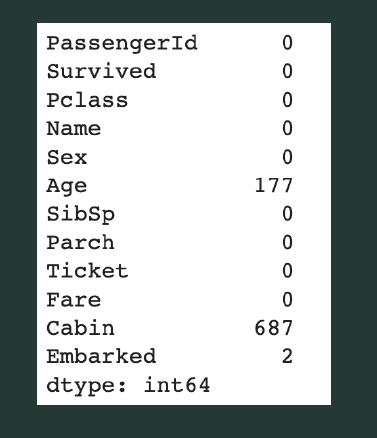
So we can see clearly now that there is some data missing from some of the columns:
We can also use the ~ character to show this. It is the reverse of the isna() method.


Stop and Reflect:
What does the bar chart tell you about the data?
By looking at the chart above, you can see the data that is present. However, it can also tell you what is missing. What kind of data is missing from this dataset?