


Testing for Normal Distribution & Homogeneity
When conducting bivariate or multivariate tests, to check our data is normally distributed, we utilise Q-Q plots. We can run Q-Q plots for normal distribution and then run a Levene’s Test for homogeneity. If we wanted to test the hypothesis: There will be a gender difference in Life Satisfaction in Great Britain,
To produce Q-Q plots for the above example we will insert the following commands into R Studio.
qqnorm(opintfd$’Life Sat'[opintfd$Gender==”Male”], main=”Male”)
qqnorm(opintfd$`Life Sat`[opintfd$Gender==”Female”], main=”Female”)
You need analyse Q-Q plots for each independent variable or case within the variable to determine whether the data is normal (or not). In this case we only needed to produce and insert two commands as Gender is a dichotomous variable however if we were looking at a variable with more than two groups each individual case would need a command to produce the respective Q-Q plot for the data. The figures shown below show the plots for our data.


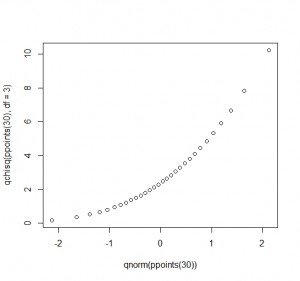
Data is deemed approximately normally distributed if the dots roughly follow a line (although they don’t have to sit on the line).
Data would be deemed not-normal if it formed an approximate S-shape.
Reviewing our Q-Q plots above we can see that our data is approximately normal because it follows along a line, we can see for both Males and Females there is a slight tail or skew to the left, but it is not great.
Interpreting Q-Q plots gets easier with time and sometimes it is just up to your own judgement, if you clean your data properly prior to assumption testing the removal of outliers should make it easier to establish normality.
Below are two examples of skewed Q-Q plots for reference, these would be deemed not-normal and would violate the parametric assumptions for normality.

Apply Your Thinking:
Interpreting Q:Q Plots
Review the outputs below and present your findings for the following assumption testing


Apply Your Thinking:
Parametric Assumption Testing
Now complete the Normality parametric assumption for the hypothesis ‘ Life Satisfaction will differ according to ethnicity in Great Britain.‘