


In this guide we will be learning how to conduct Tests for Difference, comparing two groups using SPSS. SPSS is short for Statistical Package for the Social Sciences and is a software used by various kinds of researchers to conduct complex statistical data analysis. The purpose of this guide is to build upon previous learning from the Introduction to Statistics intensive and help you to become proficient in more complex data analysis.
This guide will help you in completing other RISE intensives, such as those for other Bivariate analysis tests.
Tests for Difference: Comparing Two groups [Independent Groups]
t-test/Mann-Whitney test
In this guide we will be going through the steps for tests for difference when comparing two groups. We will be analysing two variables at a time: one variable (scale) and the other variable nominal with two response options. The aim is to identify whether the two groups differ from each other in their response to a scale (DV) variable.
When comparing two groups either a t-test (parametric) or Mann-Whitney test (Non-parametric) is to be used, which test is selected depends upon assumption testing so these always need to be tested for first.
As a reminder the three parametric assumptions are
1. The dependent variable must be measured at the Interval level (Scale/Ordinal) and the
independent variables must be measured at the Categorical level.
2. Be normally distributed
3. Be of equal variance (homogeneity)
Let’s begin with an example…
We will be continuing to use Gender and LifeSat to go through the steps for Test for Difference, we’ve already done parametric assumption testing for this variable all parametric assumptions were met and a t-test was chosen for further analysis.
You use t-test ONLY if data fulfils the condition of both normality and homogeneity of variance. If one or more conditions aren’t met a Mann-Whitney test should be used.
Running a t-test in SPSS.
Select Analyze > Compare Means > Independent-Samples T-test

Using your chosen hypothesis put the relevant variables in the appropriate boxes, the DV goes under ‘Test variable’ and IV under ‘grouping variables’. Thus, LifeSat goes in Test variable and Gender in grouping variables. Put code numbers used for males (code 1) and females (code 2) by clicking ‘Define groups’ ten click OK to get results for test.


The following outputs will be produced.


Looking at the sig. value we need to compare it with the threshold value (0.05) which we normally use for hypotheses. If the sig. value is less than 0.05, we would reject our null hypothesis and accept our research hypothesis, there is a difference.
In this example this value is more than the threshold value. Therefore, we fail to reject the null hypothesis. The findings of this study do not suggest that British people’s life satisfaction differs by Gender.
Reporting findings
The result of the t-test (Mean Male= 7.64; Mean female =7.69; t=-.627; df=2041; p=.531) is not statistically significant at the 0.05 level. We therefore fail to reject the null hypothesis. The findings of this study do not provide evidence to suggest that British people’s life satisfaction differs by gender.
Running a Mann-Whitney test in SPSS
In the previous intensive for parametric assumptions, you were set an activity to test for assumptions for the hypothesis: Life Satisfaction will differ according to ethnicity in Great Britain. If done correctly you will have noticed that this data violated the assumptions for homogeneity and thus a non-parametric test Mann-Whitney would have to be selected. We will use these variables to demonstrate how to conduct a Mann-Whitney test.
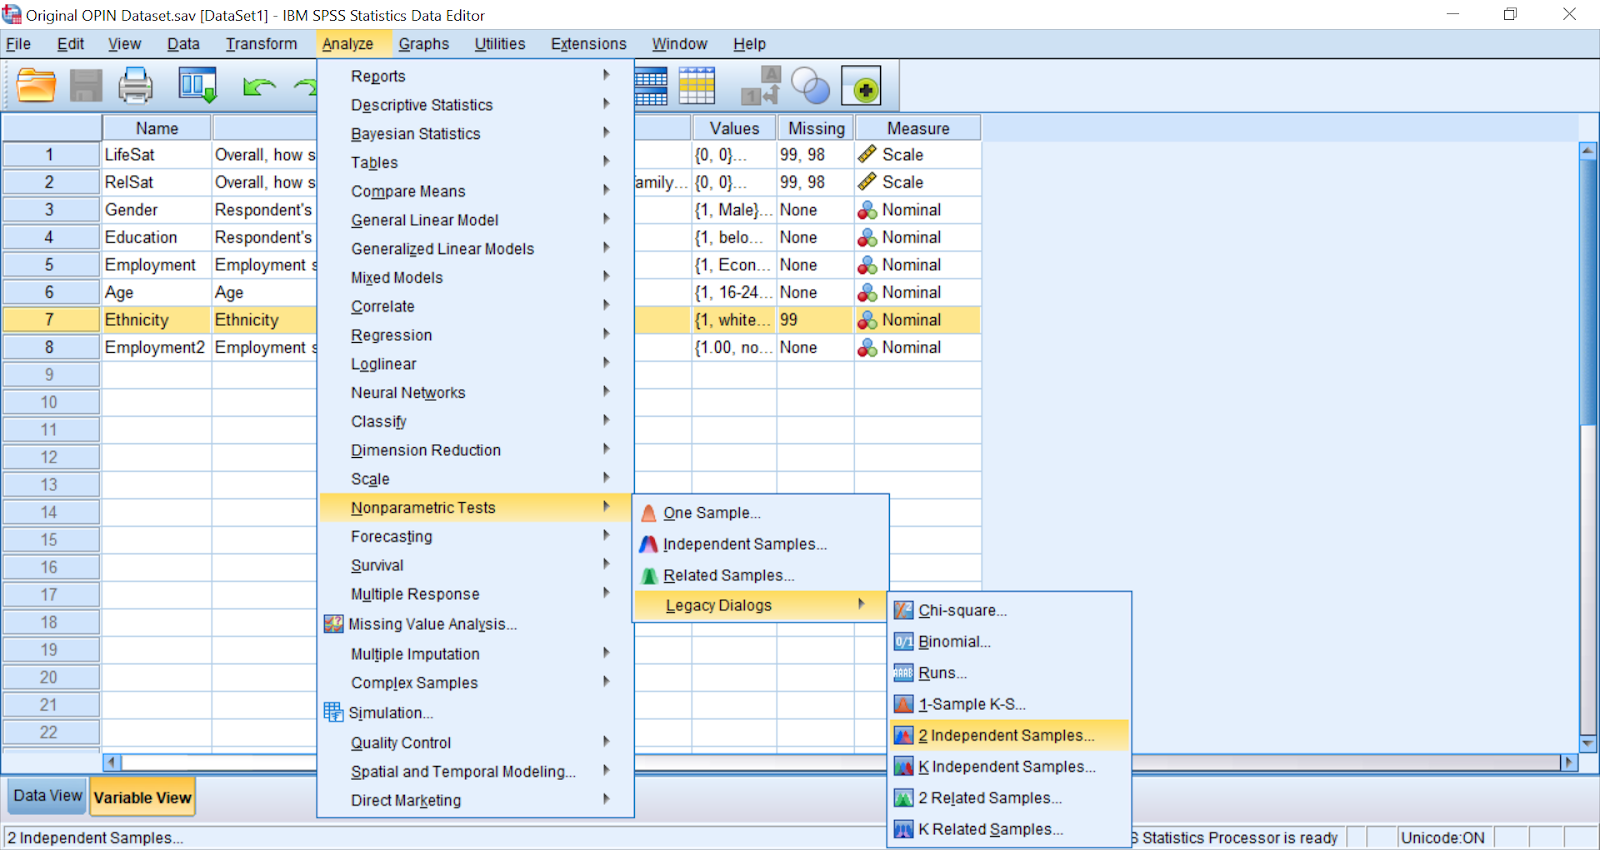
Select Analyze > Nonparametic test > Legacy Dialogs > Independent Samples
A box will pop up, in the same way as done for t-test assign the relevant variables in the appropriate boxes. LifeSat should be placed in ‘Test variable’ and Ethnicity under ‘Grouping variables’ as shown in the screenshot below.

Choose define groups.

Put code numbers used for white (1) and other (2). Click continue and make sure ‘Mann-Whitney U’ is ticked under test type. Click OK and the results to the test will be generated.
Interpreting Mann-Whitney test


The group with the higher mean rank indicates greater level of satisfaction in life. Then we’re interest in the significance value of Mann-Whitney test. If Sig is less than 0.05 we reject our null hypothesis.
Reporting Findings
The result of the Mann-Whitney test (Mean rank life satisfaction for white =1026.83; other=975.21; U= 183402.500; p=.219) isn’t statistically significant at the 0.05 level. We therefore fail to reject the null hypothesis. The findings of this study failed to provide evidence that British peoples life satisfaction differs by ethnicity.