


Exploring Data through Descriptive Statistics
One of the key things you will always do before conducting any type of statistical test is explore your data through descriptive statistics. You will remember this term from the introduction to statistics module, you were shown how to produce frequency and MoCT (Measures of Central Tendency) tables and it was explained why these tables are so useful.
Descriptive statistics is the term given to analysis that helps to describe, show or summarise data in a meaningful way, such that patterns might emerge from the data and are easily spotted. We can’t infer anything from raw data but conducting descriptive stats allows us to assess our sample prior to conducting any inferential statistics.
The introduction to statistics module demonstrated how to produce these statistics and this sprint will show you how to write up your findings and compare them to the population, judging whether they’re representative or not.
When reporting results from frequency tables it’s important to be specific about the information included, too little information the summary is meaningless and too much may bore your audience. Descriptive statistics summaries must be short and simple whilst highlighting the necessary information.
When writing descriptive summaries:
- Always report the valid percent
- Include the ‘n’ what the percentage represents i.e 63% (n2030)
- Report the research by writing in 3rd person
- Highlight any areas that are interesting or data that is surprising


Looking at this frequency table and bar chart what quickly comes to mind? Are there equal numbers of male and females? What does this mean for our data? These are the types of questions you must ask yourself when producing descriptive statistics.
The aim is never to just produce a frequency table and call it a day, but to better understand the characteristics of our data and consider any issues for future inferential analysis (comparing our sampel to the population of study). .
When describing these two screenshots one might write “Table 1 shows respondent’s genders. 48.7% (n=531) were male while 51.3% were female (n=560). There were more females than males which could affect the data however this is unlikely as the difference is small (n=29).”
Another example:

“Table 2 highlights that within our sample 96.4% (n=14617) identified as straight, 1.4% Gay/Lesbian (n=213) and 1.5% (n=226) Bisexual, 94.6% of the UK population identified as heterosexual in 2018 (Robinson, 2020) and 2% Lesbian, gay or bisexual (Weaver and Pidd, 2019) thus our sample appears representative of the wider population.”
Again, this descriptive summary reports the percentages and n of the frequency table and then takes the analysis a step further by citing supporting references to show the data is representative of the wider UK population.

Apply Your Thinking:
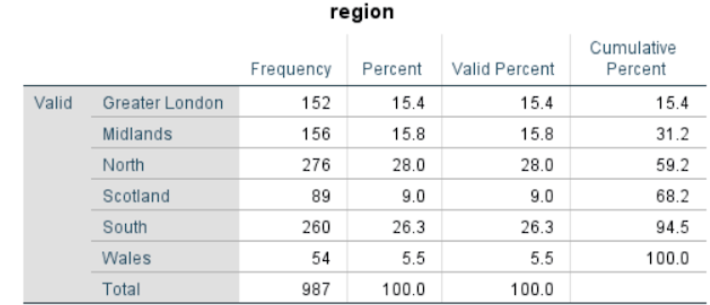
Using the frequency tables below, produce your own descriptive summaries
Note: you can use public statistics such as UK 2011 Census data to inform your analysis

[Insert summary here] |

| [insert summary here] |
| [insert summary here] |
Well done!
Data Cleaning
Data cleaning involves a series of steps that allows us to ‘clean’ our data of any errors. Please refer back to the Introduction to Statistics intensive for information on Data cleaning rationale.
This sprint will briefly recap your learning of data cleaning and introduce you to a possibly new concept, data recoding.
For the duration of this intensive we will be using a cutdown version of the Opinion and Lifestyle Survey: Well-Being Module, 2015 dataset.
When starting the process of data cleaning firstly you want to make sure that all of the variables in your dataset are correctly labelled under the ‘Measure’ column in SPSS. SPSS automatically defaults everything to Scale so you need to carefully check each variable is labelled appropriately if you’re wrong you may later end up running the wrong test.


Stop and Reflect:
Observing the variable above, can we say all of them in the dataset are correctly labelled?
Look through your dataset and correct variables if you think it is necessary.
Cleaning Categorical Data.
Although you don’t need to worry about outliers within categorical data errors on the other hand can become quite the nuisance! Cleaning allows us to remove certain answers that are redundant or unhelpful from our analysis without deleting any raw data.
I would describe redundant responses as categories which do not hold statistical or analytical power, this may be a response that few people have chosen so you decide to remove it from the data to avoid skewing the overall dataset or a category that wouldn’t provide insight during data analysis so the decision is made to clean.

‘Don’t know’ responses may be the best example of this, when a large proportion of your sample have chosen this response it may be wise to keep this category in, the category in itself is posing a unique question, why have so many people chosen don’t know. However, when only a few of your sample respondents choose a redundant response often it remains just that, redundant. Ultimately its up to you to decide sometimes whether a category is an error or not. Activity: Go through all the remaining categorical variables ensuring they have all been ‘cleaned’ sufficiently. Utilise the codebook when necessary and keep an eye out for the errors discussed above.