


What third variable should I use?
When selecting a third variable to test, it must be an IV, so that we are testing 2 IVs against 1 DV. When running multiple tests, it makes sense to use the IV that produced the largest Cramer’s V to see what difference it makes to the original test. However, as long as you can justify which variable you decide to use, you can use any.
Tip: try not to use a variable with too many categories as this leads to a lot of partial tables, making comparison more difficult and more chance of them being less valid as expected counts < 5 increases.
For this guide we will be using the Attitudes to Animal Research data.
Insert link here
We know from the chi-square sprint that our results were significant so let’s use this and add a second IV! In this case let’s see if … has any effect!
| DV | generation | Generation respondent was born in |
| IV | region | Region respondent lives in |
| IV | tabloid | Does respondent read a daily tabloid paper |
In R studio we use the Mantel-Haenszel test which is just another version of Chi Square but used for testing a third variable against our first two. Chi-square will not work on a three-way table in R Studio.
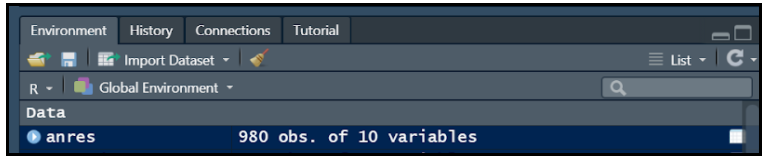
Step 1 – set your working directory! We also need to import our data from an excel file into R Studio using the ‘readxl’ package. If you require a more in-depth tutorial on how to do this refer to the introduction and univariate analysis intensives for R Studio.
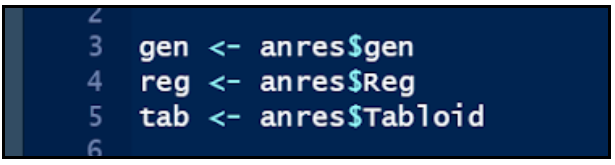
Step 2 – We can now shorten our dataset name to make it easier to code further along. To do this we need to use the following code:

Remember: to enter code we need to press ctrl + Ent
The <- symbol allows us to create new variables and shortened datasets! For this example, we have shortened it to ‘anres’, this should be available to view in the environment pane.
Step 3 – We can now produce our three variables and shorten them.
After each one press ctrl and Ent, you should see them appear in the environment field under values. To check the tables have worked correctly we can type each of the new names into the script and press ctrl and Ent.
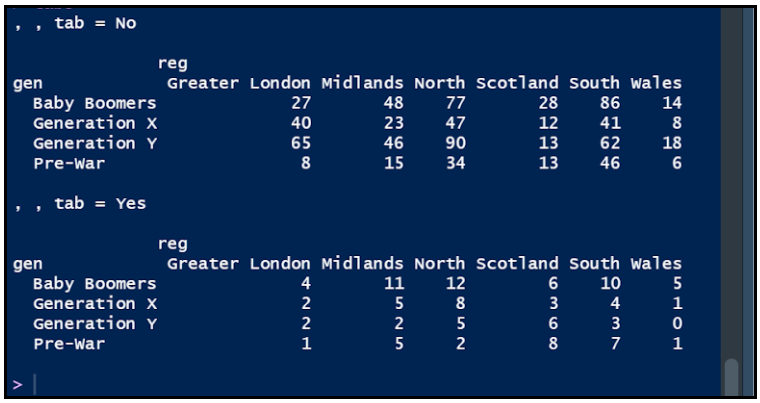
Step 4 – now we need to produce a table that includes all three of our variables to do this we use:
table (var1, var2, var3)

We need to make sure that var 3 is our 2nd IV when typing in this code!

We should get two frequency tables one for each category of our 2nd IV
Step 5 – We can now run the Mantel-Haenszel test in R studio. We only need one piece of code for this.

Remember, to change the p value to a decimal we use:
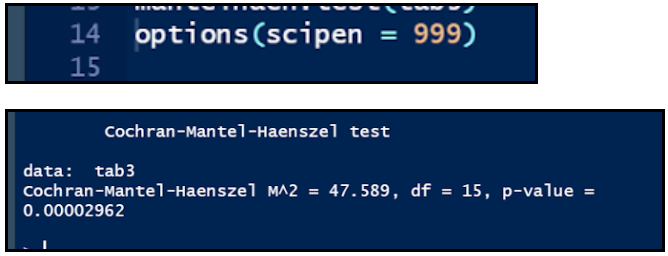
WELL DONE YOU CAN NOW PERFORM AN ELABORATION!