


The first important stage when analysing data is to perform data cleaning on the variables. This is essentially removing errors and outliers and tidying up the data. There are a number of reasons for doing this, such as:
- In analysis you want to run the strongest tests possible, so cleaning the data to remove outliers might make there a better chance of achieving normality, and thus allowing the potentially stronger test to be run
- To ensure the data is appropriate for conducting specific tests
- To ensure no loss of statistical power through outliers
- To remove any errors on the dataset (all datasets will have some degree of errors from the inputting stage making it easy to make mistakes)
- To promote the most accurate and reliable results possible from the data testing
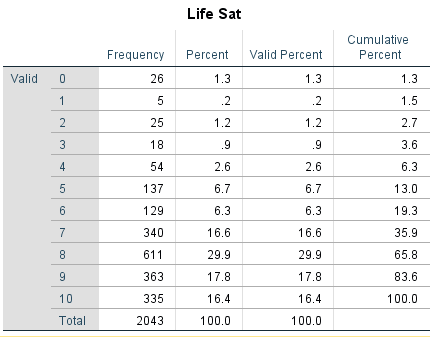
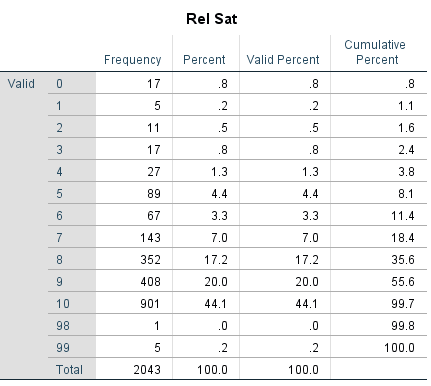
Firstly, run frequency tables on the two scale variables to identify any outliers or errors.
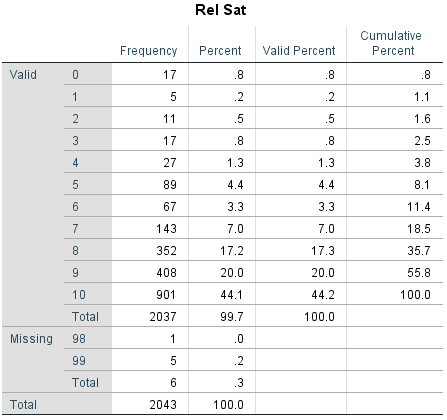
The life satisfaction variable is fine as it only contains the values 0-10, which reflects the likert scale of that variable.
However, the relationship satisfaction variable has values 98 and 99 which are missing answers or potential errors. These need to be put as missing values.
Checking for the outliers in data view:
Click on the data view and find the relationship satisfaction variable. Right click on the name and click sort-descending.
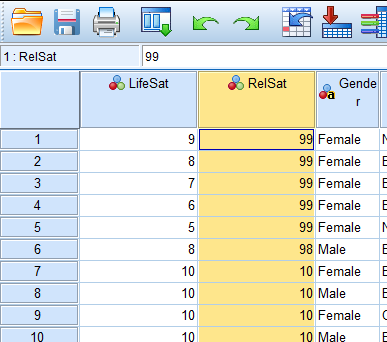
The outliers 99 and 98 values appear at the top.
Inserting missing values in variable view:
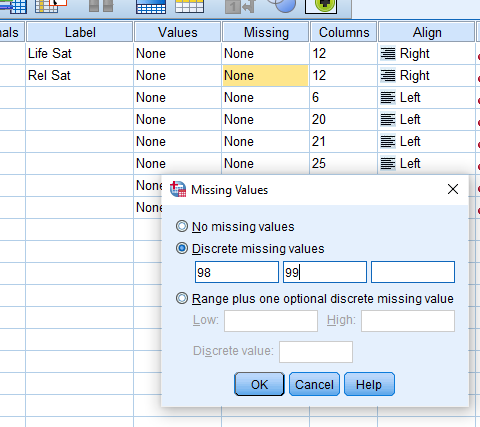
We want to go back to variable view and go to the ‘Missing’ column. Click on the variable you want to enter missing values for and select discrete missing values.
Insert 98 and 99 and select OK.
Check with frequency table
TASK: Have a go at cleaning the data on the opinions and lifestyle survey, write down the variable name that needs cleaning, what needs cleaning from the variable and present before and after screenshots of the cleaned variable.