


When should we use Chi-Square?
Chi-square should be used when working with categorical data, not scale. To help remind yourself, use the handy decision tree below for inferential tests to see which would be most appropriate for your research!
Bivariate Analysis Decision Tree
| Independent Variable: | [insert the name of your IV here] |
| Dependent Variable: | [insert the name of your DV here] |
| Null Hypothesis: | [insert NH: remember to mirror with the RH below] |
| Research Hypothesis: | [insert RH here] |
The Decision Tree below requires you to tick 1 Box for each row
Remember…
| Step 1 – Expected Counts | Yes | No | ||||||||
| Are there any cells with expected counts less than 5? REMEMBER: If any expected cells are less than 5 and you HAVE cleaned all of your variables, report that the Chi-Square test cannot be carried out because of this. | ☐ | ☐ | ||||||||
| Step 2 – p Value | Yes | No | ||||||||
| Is the p value below .05?If Yes, reject Null Hypothesis and report Cramer’s V and column %. If No, accept the Null Hypothesis. | ☐ | ☐ | ||||||||
| Step 3 – Cramer’s V | .1 | .2 | .3 | .4 | .5 | .6 | .7 | .8 | .9 | 1 |
| Where on the scale, does the Cramer’s V score fall? | ☐ | ☐ | ☐ | ☐ | ☐ | ☐ | ☐ | ☐ | ☐ | ☐ |
| How Strong? | Weak☐ | Med☐ | Strong ☐ | V Strong☐ | Strange☐ | |||||
| Step 4 – Reporting Column % | [insert group name] | [insert column percent] | ||||||||
| Which column percent shows the most difference between your groups? | [insert group name] | [insert column percent] |
To be able to use a chi-square for your analysis, it first must meet some assumptions:
- To be able to perform a chi square test requires random sampling
- No cell should contain less than 5 observations. Chi- square is sensitive to low expected cell counts so cannot be used
This can be checked when creating the expected values tables!
- It is also sensitive to large sample sizes. However, this is not usually a problem as it means EXTREMELY high numbers
How to formulate Hypotheses for Chi square
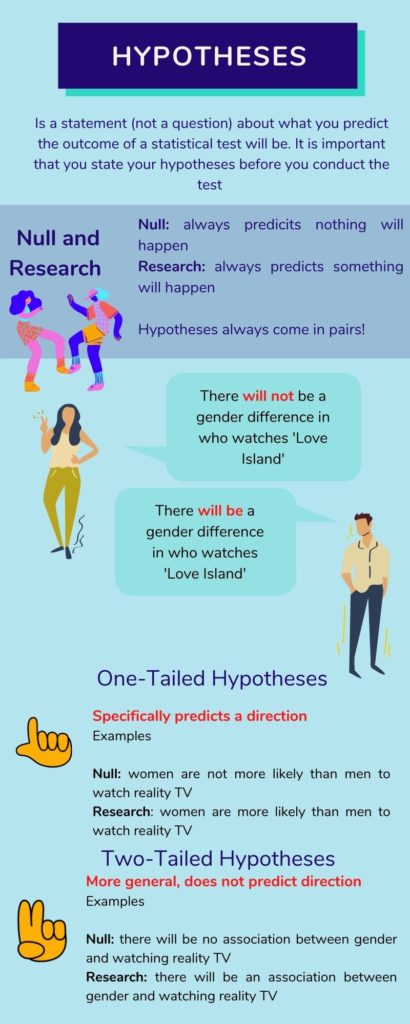
A hypothesis is a statement (not a question) about what you predict the outcome of a statistical test will be. It is important that you state your hypotheses before you conduct the test and in essence, make your prediction beforehand.
A basic hypothesis will have both a null statement and research statement, these MUST mirror each other. The null hypothesis is the negative/opposite of the research hypothesis and says that ‘nothing’ will happen. For example:
Null: There will not be an association between age groups and music genre listened to.
Research: There will be an association between age groups and music genre listened to.
Hypotheses can also be either one-tailed or two tailed and it is important when working on research you select which type you use based on literature you have read and discussed.
One-tailed: this is a directional hypothesis and suggests that one group will/ will not be associated with another variable more/less than another group.
e.g., young people will be more likely to listen to pop music than older people
Two-tailed: this does not give direction to a hypothesis and is more general. This may be used when research or pre-existing literature doesn’t suggest a trend or one group being more/less likely associated with your second variable.
e.g., There will be an association between age groups and music genre listened to.
Independent Variables (IV’s) and Dependent Variables (DV’s)
In our hypotheses, we tend to use two variables, we need to decide which is our dependent variable and which is our independent variable!
Independent variable: not influenced by other variables you are measuring. Instead, independent (or predictor) variables are the factors that influence the dependent variables. Examples might include gender and age.
Dependent variable: relates to what you are measuring in a statistical test, and depends on other factors (i.e. the independent variable). It is an outcome variable, showing the effect of the independent variable. Examples might include mobile phone use, and views on sentencing or social media usage.
It is sometimes possible for a variable to be an independent variable (IV) in one hypothesis, and a dependent variable (DV) in another hypothesis. The important thing is that you work out which is the IV and the DV for each hypothesis you develop. It is important not to use a DV as an IV even if it seems like it might provide some interesting findings.