


The data we are going to analyse is a cutdown dataset from the Opinions and Lifestyle Survey: Well-Being Module, 2015. This is the same dataset we’ve been using throughout this Rise course so it should already be saved in a secure folder. Details about the study can be found online at shorturl.at/mtyCZ.
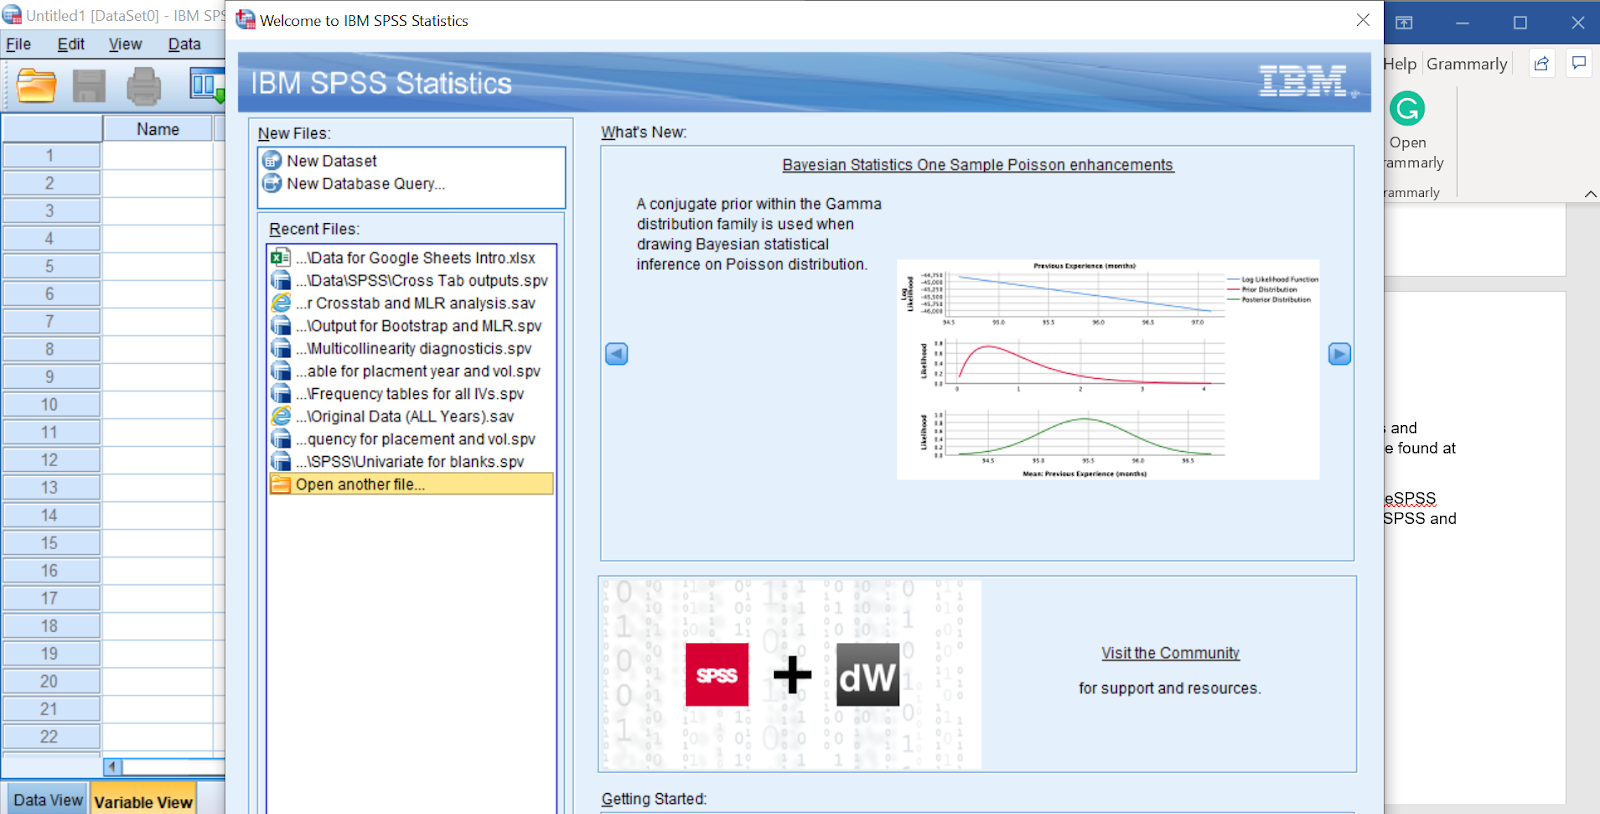
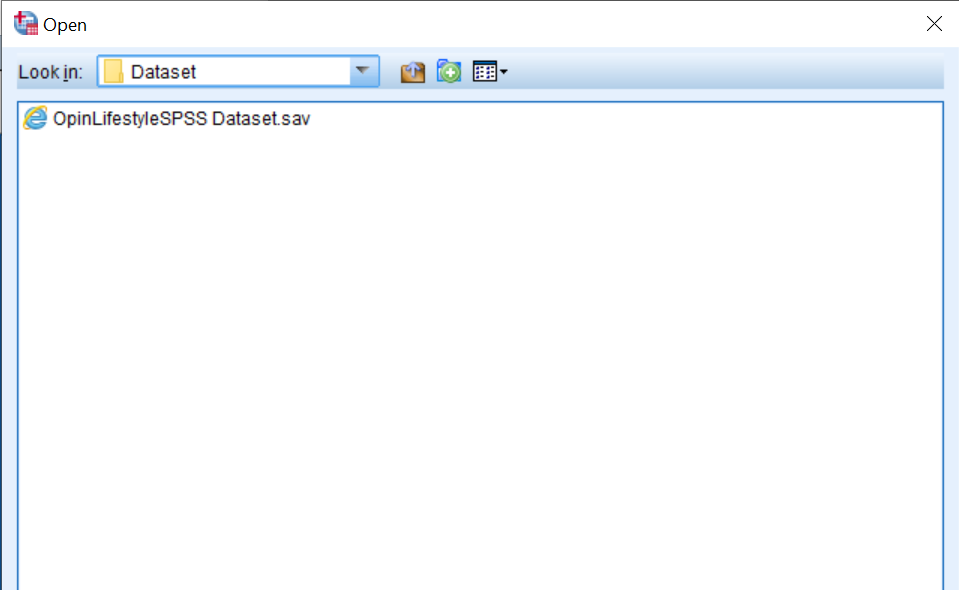
Steps: Run SPSS > click open another file > Find relevant file > open into SPSS > the dataset should then load into the SPSS Variable View window.
These steps are also illustrated in screenshots below.

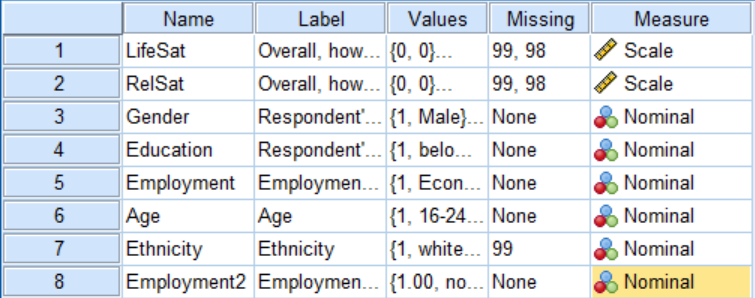
Your data should look like the screenshot below, especially if you’ve been following the steps in previous sprints. The data shown below has been cleaned and one variable ‘Employment2’ is an example of recoding.
This screenshot shows a customized variable view, if you haven’t already done so to customise your own, go to view >customize variable view, you only need the columns shown below.
Step 2 – Data Preparation
Data preparation for Tests for Difference was explored in a previous intensive so we won’t repeat these steps here. However, it’s worth remembering that you need to always:
- Explore data through descriptive statistics
- Create hypotheses
- Identify levels of measurement for variables
- Clean your data.
- Recode variables where necessary.
- Identify most suitable test for measurement type & hypothesis
- Test for Sampling Error and confidence.
Again, this has all been outlined in previous guides.