


Cleaning Interval Data
Interval data such as Scale is highly susceptible to outliers, these outliers can then skew your data, we want to avoid this occurring at all costs because outliers can mean we fail to meet the parametric assumptions necessary for certain tests (you’ll be introduced to parametric assumptions in the next intensive).
We need to identify if we have any outliers present within our data. We will use the variable LifeSat to demonstrate.
Identifying Outliers and Errors
Firstly, we will run a Measures of Central Tendency (MCT) for the variable LifeSat. The screenshots for this are shown below.

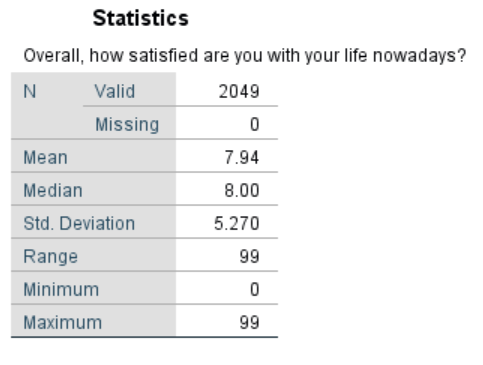
Observing the MCT we can see our range is 99, with the minimum being 0 and maximum being 99, we might instantly assume that we have an error, but we should first consult our codebook. Doing so we can see that 98 and 99 can be ascertained as errors because Life Sat was measured on a scale of 1-10 and these values fall outside of this.
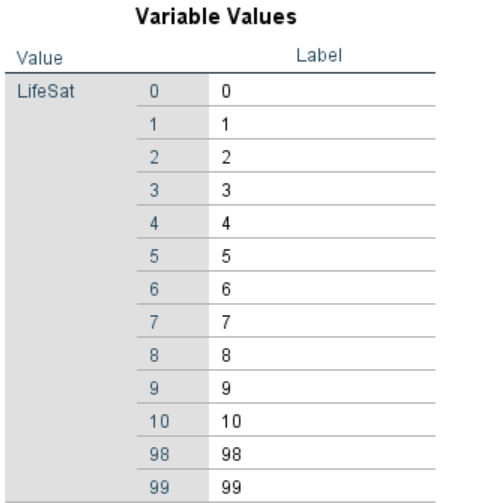
The values 99 and 98 should then be added to our missing column in SPSS, effectively cleaning them from our analysis. Re-running a MCT for this variable you will see the table change, reflecting the removal of the values that were skewing our data. This variable is now ready to use in our analysis!

Apply Your Thinking:
Using these steps…
Clean the scale variable ‘Rel Sat’.